Shares will crash soon
It’s time to reduce your risk, if you can – sell your over-priced house and rent, shift your retirement fund to cash. If you have these assets you’ve already gained from the boom, so don’t wait round hoping for more, get out before you lose big time.
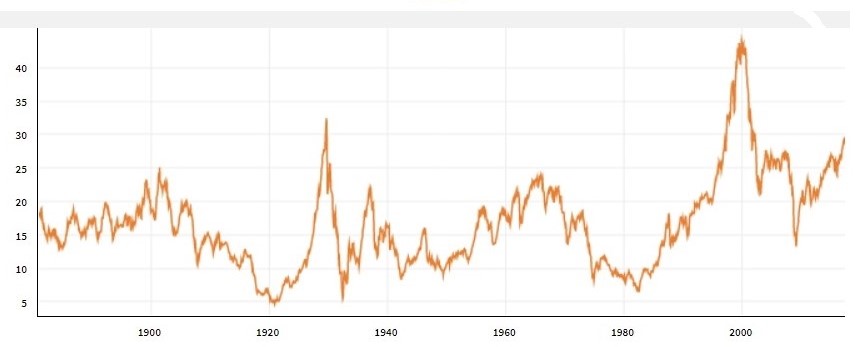
Shiller price-earnings ratio chart – note the 1929, 2010, 2017 highs
This time it’s not about dodgy mortgage securities or over-priced internet companies, it’s about fundamentals. Companies are not robust, demand is low, and all sorts of risks lurk in the wings – EU debt, national deficits, indebted governments, vulnerable developing economies, the reversal of quantitative easing, Trump likely to start a trade war or a real war – yet share prices are as high as in 1929 by several measures. Don’t wait to find out which risk hits home first, toppling this house of cards.
Jared Dillan provides the best explanation for why the market has got so over-valued in a Bloomberg opinion piece entitled “The stockmarket has entered Bizarro World’ (that’s a Superman comic book world where everything is backwards). He argues that after the financial crisis all corporations got cheap debt and share-price support via quantitative easing, so funds that tried to pick winners were no more successful than across-the-board indexed funds.
Since managed funds had higher fees, investors exited to indexed funds in droves – creating indiscriminate across-the-board upward pressure on the share-prices of all companies and an irrestible boom-bubble. Read the full article here on www.bloomberg.com
Below are further links to the source for the chart above, to other measures for and commentary about share-price value:
Shiller price-earnings ratio by month, note the 1929, 2010, 2017 highs: www.quandl.com
Warren Buffett’s market indicator reaches new 10-year high: www.nasdaq.com/article
Short recent commentary here: www.mrkt.co.in
An earlier, more in-depth explanation of these measures: www.valuewalk.com/
Update 27 July – US Reserve Bank holds back on rates rise but brings forward their timetable to dispose of the US$4.5 trillion of bonds (debt) and securities (packaged, often illiquid assets) bought to keep prices up. So prices will come down when they do… Sources:
http://www.latimes.com/business/la-fi-federal-reserve-stimulus-20170710-htmlstory.html
http://www.reuters.com/article/us-usa-fed-instant-idUSKBN1AB2OG